OOT in Pharmaceutical Industry refers to a test result that remains within the approved specification but shows an unexpected trend compared with historical data or established process behavior.
For example, an API assay specification may be 98.0–102.0%, while successive batches show 100.5%, 100.1%, 99.6%, 99.2% and 98.8%. Although every result meets the specification, the continuous downward trend may indicate developing process variation.
OOT monitoring helps pharmaceutical companies identify such changes before they become serious quality problems. It can provide an early warning of process drift, analytical variation, equipment deterioration, raw material changes or potential future OOS results.
What Is OOT in Pharmaceutical Industry?
OOT stands for Out of Trend.
An OOT result generally refers to a result that is within the approved specification but is unusual when compared with historical results or expected process performance.
OOT can be identified through:
- Historical batch data
- Statistical analysis
- Trend charts
- Control charts
- Process monitoring
- Product quality review
- Established internal alert criteria
It is important to understand that an OOT result is not automatically an OOS result.
Simple Example
Suppose an API has an assay specification of:
98.0–102.0%
Historical results:
| Batch | Assay |
|---|---|
| B001 | 100.4% |
| B002 | 100.1% |
| B003 | 99.8% |
| B004 | 99.4% |
| B005 | 99.0% |
All results are within specification.
However, the consistent downward movement may require evaluation under the organization’s OOT procedure.
Why Does OOT Matter in Pharmaceutical Manufacturing?
Specifications generally establish whether a product meets predefined quality requirements. Trend analysis provides additional information about how the process behaves over time.
A product can meet specification while the underlying process is gradually changing.
Effective OOT monitoring can help identify:
- Process drift
- Increasing process variability
- Equipment deterioration
- Raw material variability
- Analytical variation
- Sampling issues
- Environmental changes
- Manufacturing inconsistencies
- Potential future OOS conditions
OOT as an Early Warning
A typical relationship can be represented as:
Normal Process → Process Drift → OOT Signal → Investigation → Corrective Action → Stable Process
Without appropriate monitoring:
Process Drift → Continued Variation → OOS → Investigation
This makes trend monitoring a valuable component of proactive pharmaceutical quality management.
How Is the Pharmaceutical Industry Benefiting From OOT?
OOT monitoring provides value beyond simply identifying unusual laboratory results.
1. Early Detection of Process Drift
A gradual change can be identified before the result reaches a specification limit.
2. Prevention of Potential OOS Events
Investigation of an OOT trend can help address developing problems before they become specification failures.
3. Better Process Understanding
Historical data provide information about normal process behavior and variation.
4. Improved Product Consistency
Trend monitoring can reveal gradual changes affecting critical quality attributes.
5. Equipment Performance Monitoring
A change in product results may indicate deterioration in equipment performance.
6. Better Decision Making
Statistical and historical data provide a stronger basis for quality decisions.
7. Continuous Improvement
Recurring trends can identify opportunities for process and equipment improvements.
OOT vs OOS: What Is the Difference?
OOT and OOS should not be treated as interchangeable terms.
| Parameter | OOT | OOS |
|---|---|---|
| Full form | Out of Trend | Out of Specification |
| Result | Generally within specification | Outside specification |
| Main concern | Unexpected behavior/trend | Specification failure |
| Primary purpose | Early warning | Failure investigation |
| Example | Assay gradually decreasing | Assay below specification |
| Typical response | Trend assessment/investigation | Formal OOS investigation |
Example
Specification:
98–102%
Assay result:
99.0%
The result passes specification but may be OOT if it represents an unexpected change from historical behavior.
Assay result:
96.5%
This is OOS because it is outside the approved specification.
Therefore:
OOT identifies unusual process behavior, while OOS identifies a specification failure.
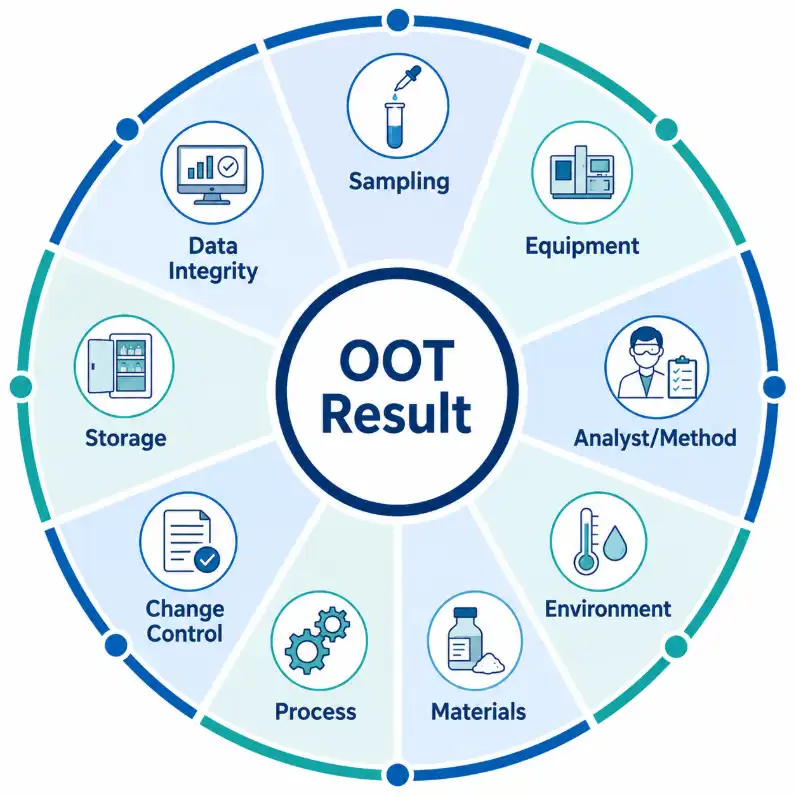
What Are the Common Causes of OOT Results?
OOT signals can originate from different parts of the pharmaceutical manufacturing and testing system.
Analytical Causes
Possible laboratory-related factors include:
- Instrument variability
- Calibration issues
- Method variability
- Standard preparation
- Reagent preparation
- Sample preparation
- Analyst technique
- Instrument maintenance
- System suitability
- Calculation differences
Manufacturing Causes
Potential process-related causes include:
- Temperature variation
- Reaction-time variation
- pH variation
- Mixing problems
- Drying variation
- Agitation changes
- Addition-rate variation
- Pressure variation
- Equipment deterioration
Material Causes
Raw material changes may affect process performance.
Review:
- Supplier
- Material lot
- Assay
- Moisture
- Particle size
- Purity
- Storage conditions
- Material age
Sampling Causes
Sampling-related factors may include:
- Non-representative sampling
- Sampling location
- Sample quantity
- Sample handling
- Storage
- Sampling procedure
What Are the OOT Procedures?
The exact procedure should be defined in the organization’s approved quality system. A typical approach can include:
OOT Detection → Preliminary Assessment → Data Verification → Historical Review → Investigation → Root Cause Analysis → Impact Assessment → Corrective Action/CAPA → Follow-Up
OOT Detection
The unusual result may be identified through:
- Routine QC testing
- Batch trending
- Statistical monitoring
- Process monitoring
- Product quality review
- Environmental monitoring
Preliminary Assessment
The initial assessment may review:
- Current result
- Specification
- Historical results
- Previous batches
- Product trends
- Established OOT criteria
Data Verification
Before drawing conclusions, verify:
- Original data
- Calculations
- Sample identification
- Analytical sequence
- Instrument records
- System suitability
- Standards
- Reagents
- Raw data
- Audit trail where applicable
Historical Review
Compare the result with:
- Previous batches
- Previous campaigns
- Different raw material lots
- Different analysts
- Different instruments
- Previous deviations
- Previous OOS/OOT events
How to Handle Out of Trend Results?
When an OOT result is identified, it should not simply be ignored because it remains within specification.
A practical approach is:
1. Confirm the Result
Verify that the original data are correct and complete.
2. Review Historical Behavior
Compare the result with appropriate historical data.
3. Evaluate the Laboratory
Check the analytical method, instrument, analyst, standard, reagents and sample preparation.
4. Evaluate Manufacturing
Review process parameters, equipment, raw materials and batch records.
5. Determine the Root Cause
Use an appropriate investigation methodology.
6. Assess Product Impact
Determine whether the trend could affect current or future product quality.
7. Implement Appropriate Actions
Corrective action or CAPA may be considered depending on the investigation.
8. Monitor Subsequent Results
Continue trending to confirm whether the issue has been corrected.
When Should an OOT Investigation Be Started?
An investigation should be initiated according to predefined criteria.
Potential triggers may include:
- Significant movement from historical average
- Repeated upward or downward results
- Statistical warning signal
- Unexpected change in a critical quality attribute
- Unexpected change in a critical process parameter
- Result approaching a specification limit
- Recurring unusual results
- Significant process shift
Not every difference between two batches represents an OOT condition.
The assessment should consider:
Magnitude + Direction + Historical Behavior + Process Knowledge + Statistical Evidence + Established Criteria
How Do You Identify an OOT Trend?
Consider the following API assay data:
| Batch | Assay (%) |
|---|---|
| B101 | 100.5 |
| B102 | 100.3 |
| B103 | 100.0 |
| B104 | 99.6 |
| B105 | 99.2 |
| B106 | 98.8 |
Specification:
98.0–102.0%
The latest result is still within specification.
However, the trend is moving consistently downward.
The investigation should consider:
- Is the change statistically significant?
- Is the process average shifting?
- Have raw materials changed?
- Have process parameters changed?
- Has equipment performance changed?
- Has the analytical method changed?
- Is the trend occurring across other batches?
What Should Be Checked During an OOT Investigation?
A good investigation should not focus on only one department.
Laboratory Investigation
Review:
- Analytical method
- Analyst training
- Instrument calibration
- Instrument qualification
- System suitability
- Standard preparation
- Reagent preparation
- Sample preparation
- Calculations
- Chromatograms
- Historical laboratory data
Manufacturing Investigation
Review:
- Batch manufacturing record
- Process parameters
- Temperature
- Pressure
- pH
- Agitation
- Reaction time
- Addition sequence
- Drying conditions
- Yield
Equipment Investigation
Review:
- Calibration
- Maintenance
- Qualification
- Breakdown history
- Preventive maintenance
- Equipment performance
- Alarm history
Material Investigation
Review:
- Supplier
- Material lot
- Certificate of Analysis
- Storage
- Material properties
- Supplier trends
How Is OOT Trending Performed?
OOT trending involves collecting appropriate data and evaluating changes over time.
A typical approach is:
Collect Data → Verify Data → Organize Data → Plot Trend → Compare Historical Behavior → Statistical Evaluation → Investigation
Parameters Commonly Trended
- Assay
- Related substances
- Moisture
- Dissolution
- pH
- Yield
- Particle size
- Potency
- Microbial results
- Environmental monitoring results
- Critical process parameters
Trend analysis can be performed using spreadsheets, statistical software or validated systems, depending on the application and quality-system requirements.
Which Statistical Tools Are Used for OOT Analysis?
Statistical methods can provide additional evidence when evaluating trends.
Mean
The mean represents the average of observations.
For example:
Results:
99, 100, 101
Mean:
100
Standard Deviation
Standard deviation indicates the amount of variation around the average.
Control Charts
Control charts can help identify unusual process behavior over time.
They commonly display:
- Central line
- Upper control limit
- Lower control limit
- Individual data points
Moving Average
A moving average can reduce short-term fluctuations and make longer-term trends easier to visualize.
Process Capability
Cp and Cpk may be useful for suitable continuous data sets when the assumptions and application are appropriate.
Importantly, specification limits and control limits are not the same.
Specification limits are related to product requirements, while control limits are derived from process behavior.
Practical OOT Example: API Assay Trending Downward
Consider an API with:
Assay Specification = 98.0–102.0%
| Batch | Assay |
|---|---|
| B01 | 100.6% |
| B02 | 100.3% |
| B03 | 100.0% |
| B04 | 99.6% |
| B05 | 99.2% |
| B06 | 98.7% |
Observation
Every batch passes specification.
However, the results show a clear downward movement.
Investigation Areas
The investigation team may review:
- Raw material assay
- Reaction conversion
- Reaction temperature
- Reaction time
- Catalyst quantity
- Equipment performance
- Sampling
- Analytical method
- Previous batch trends
Suppose the investigation identifies a gradual change in a raw-material characteristic.
The team should then establish, using appropriate evidence, whether that change explains the assay trend.
Practical OOT Example: Moisture Increasing After Drying
Suppose an API has:
Moisture Specification = NMT 1.0%
| Batch | Moisture |
|---|---|
| B01 | 0.42% |
| B02 | 0.45% |
| B03 | 0.50% |
| B04 | 0.58% |
| B05 | 0.65% |
| B06 | 0.73% |
The results are still within specification, but moisture is gradually increasing.
Areas to Review
- Drying temperature
- Drying time
- Vacuum
- Dryer loading
- Product bed depth
- Filter condition
- Vacuum-system performance
- Sampling
- Moisture analyzer
If vacuum performance has deteriorated, equipment performance could be a potential contributor.
Practical OOT Example: Dissolution Trending Downward
Suppose the dissolution specification is:
NLT 80%
| Batch | Dissolution |
|---|---|
| B01 | 95% |
| B02 | 94% |
| B03 | 92% |
| B04 | 89% |
| B05 | 86% |
| B06 | 83% |
The results remain within specification but show a downward trend.
Possible investigation areas include:
- Granulation
- Compression force
- Tablet hardness
- Lubrication time
- API particle size
- Disintegration
- Blend uniformity
- Manufacturing parameters
- Dissolution apparatus
The purpose is to determine whether a process change is causing the observed trend.
How Does OOT Investigation Help Identify Root Cause?
Root cause analysis should focus on why the trend occurred, not merely what was observed.
Useful tools include:
- 5 Why Analysis
- Fishbone Diagram
- Trend Analysis
- Pareto Analysis
- Fault Tree Analysis
- Risk Assessment
- Process Mapping
Example
Problem: Moisture is gradually increasing.
Why? Drying performance has decreased.
Why? Vacuum performance has reduced.
Why? Vacuum-system efficiency has deteriorated.
Why? Equipment condition has changed.
The proposed root cause should then be verified with objective evidence such as maintenance records, equipment trends and process data.
What Is the Role of CAPA in OOT?
CAPA may be appropriate when the investigation identifies a systemic or recurring issue.
Possible actions include:
- Equipment modification
- Preventive maintenance improvement
- SOP revision
- Process optimization
- Additional monitoring
- Analytical method improvement
- Supplier action
- Additional process controls
Training should not automatically be selected as the CAPA for every event. The investigation should establish whether training was actually a contributing cause.
The CAPA should address the underlying cause and should have appropriate effectiveness criteria where applicable.
How Can OOT Help Prevent OOS?
OOT can provide an opportunity to act before a specification failure occurs.
For example:
Normal Assay → Gradual Decrease → OOT Signal → Investigation → Root Cause → Corrective Action → Process Stabilization
Without appropriate trend monitoring:
Normal Assay → Gradual Decrease → Continued Drift → OOS
This is one of the major practical benefits of an effective OOT system.
OOT and Continued Process Verification
OOT monitoring can also support ongoing process monitoring and continued process verification.
Trending can help identify changes in:
- Critical Quality Attributes
- Critical Process Parameters
- Equipment performance
- Process variability
- Material characteristics
- Yield
Historical trends can therefore provide useful evidence about whether a validated process continues to perform consistently.
What Are the Common Challenges in OOT Management?
Limited Historical Data
New products may not have enough historical data to establish meaningful trends.
Too Many False Signals
Poorly defined OOT criteria may generate unnecessary investigations.
Poor Data Quality
Incomplete or inconsistent historical records can reduce the reliability of trend analysis.
Statistical Limitations
Incorrect statistical methods may lead to misleading conclusions.
Departmental Silos
Reviewing only laboratory data may cause manufacturing contributors to be missed.
Weak Investigation Documentation
The investigation should clearly explain the data reviewed, reasoning, evidence and final conclusion.
OOT Investigation Checklist
Initial Review
- OOT result identified
- Specification verified
- OOT criteria checked
- Historical data reviewed
- Original data verified
Laboratory Review
- Analytical method reviewed
- Analyst checked
- Instrument checked
- Calibration verified
- System suitability reviewed
- Standards checked
- Reagents checked
- Calculations reviewed
Manufacturing Review
- Batch record reviewed
- Process parameters reviewed
- Equipment history reviewed
- Raw materials reviewed
- Sampling reviewed
- Previous batches reviewed
Final Assessment
- Trend evaluated
- Root cause investigated
- Product impact assessed
- CAPA evaluated
- Follow-up criteria established
- Investigation documented
OOT Interview Questions
1. What does OOT stand for?
OOT stands for Out of Trend.
2. What is OOT in pharmaceutical manufacturing?
It refers to an unexpected result or trend that generally remains within specification but differs from historical or expected process behavior.
3. What is the difference between OOT and OOS?
OOT generally indicates an unexpected trend, while OOS means that a result is outside an approved specification.
4. Can an OOT result be within specification?
Yes. OOT results are generally within specification but may show unusual behavior compared with historical data.
5. Why is OOT monitoring important?
It can identify process drift and potential quality problems before they develop into specification failures.
6. What should be reviewed during an OOT investigation?
Laboratory data, analytical method, instruments, sampling, raw materials, manufacturing parameters, equipment and historical trends should be evaluated as applicable.
7. Can OOT become OOS?
Yes. If the underlying trend continues without appropriate intervention, it may eventually result in an OOS condition.
Conclusion
OOT in Pharmaceutical Industry is an important proactive approach to pharmaceutical quality and process monitoring. Unlike OOS, which identifies a result outside an approved specification, OOT focuses on unexpected changes in product or process behavior.
A strong OOT system combines historical data, trend analysis, laboratory review, manufacturing investigation, statistical evaluation, root cause analysis and appropriate follow-up.
The most important principle is simple:
A result can meet specification and still provide an important warning if the process is moving away from its normal behavior.
By identifying these changes early, pharmaceutical organizations can investigate developing problems, improve process control, reduce the likelihood of future OOS events and maintain consistent product quality.
Frequently Asked Questions
Q1. What is OOT in Pharmaceutical Industry?
OOT in Pharmaceutical Industry refers to an unexpected result or trend that generally remains within approved specification but differs significantly from established historical or expected process behavior.
Q2.What is an example of OOT?
A gradual reduction in API assay from 100.5% to 98.7% across several batches, while the specification is 98–102%, is an example of a potential OOT trend.
Q3. How do you investigate an OOT result?
The investigation generally involves data verification, historical trend review, laboratory assessment, manufacturing review, root cause analysis, impact assessment and appropriate corrective action.
Q4. Is OOT the same as OOS?
No. OOT generally identifies unexpected behavior within specification, while OOS identifies a result outside the approved specification.
Q5. Why is OOT trending important?
OOT trending can provide an early warning of process drift, equipment deterioration, analytical variation or other developing quality issues.