In the chemical and pharmaceutical industries, understanding how materials move through a process is extremely important. Engineers and plant designers need a clear way to visualize the entire production process before the plant is built or operated. This is where a Process Flow Diagram (PFD) becomes an essential engineering tool.
A Process Flow Diagram (PFD) is a graphical representation of the major equipment and flow of materials within a process plant. It shows the relationship between different process units and helps engineers understand the overall production workflow.
For industries such as pharmaceuticals, petrochemicals, food processing, and biotechnology, the Process Flow Diagram (PFD) plays a crucial role in plant design, process optimization, troubleshooting, and documentation. Engineers use it to communicate process information clearly among different departments including production, quality assurance, safety, and management.
In this detailed guide from pharmacalculations.in, you will learn what a Process Flow Diagram (PFD) is, its components, symbols, advantages, and how it is used in pharmaceutical manufacturing.

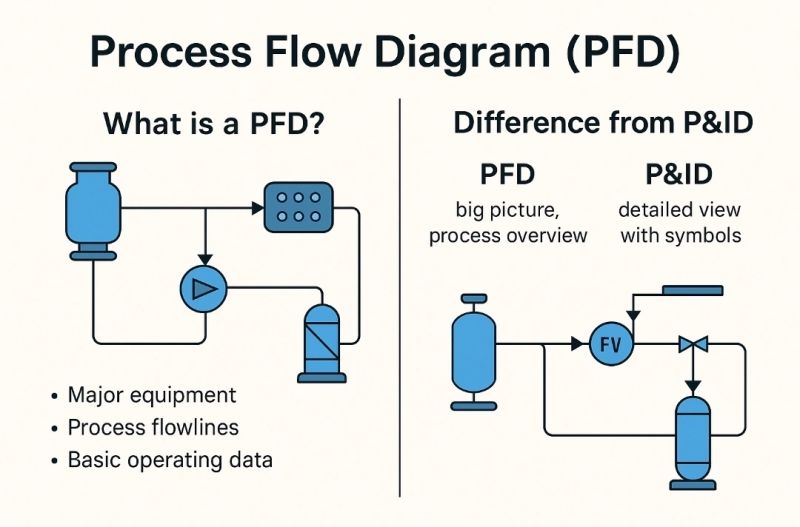
What is a Process Flow Diagram (PFD)?
A Process Flow Diagram (PFD) is a simplified diagram that illustrates the main process equipment and the flow of materials between them. It focuses on major process steps rather than detailed piping or instrumentation.
The primary objective of a Process Flow Diagram (PFD) is to provide a clear overview of how raw materials are converted into final products in an industrial process.
In pharmaceutical manufacturing, the Process Flow Diagram (PFD) typically shows:
Reactors
Distillation columns
Heat exchangers
Pumps
Storage tanks
Separation units
Material flow streams
Unlike detailed engineering drawings, a Process Flow Diagram (PFD) highlights only the key process elements required to understand the system operation.
Key Components of a Process Flow Diagram (PFD)
A standard Process Flow Diagram (PFD) includes several essential components that help engineers visualize the process.
1. Process Equipment
The Process Flow Diagram (PFD) includes major equipment used in the process such as:
Reactors
Mixers
Heat exchangers
Distillation columns
Evaporators
Filters
Dryers
Each piece of equipment is represented using standard engineering symbols.
2. Process Streams
Process streams represent the flow of materials between different units. In a Process Flow Diagram (PFD), these streams usually include:
Raw materials
Intermediate products
Final products
Waste streams
Utilities
Stream numbers and flow directions are clearly indicated.
3. Flow Direction
Arrows are used in a Process Flow Diagram (PFD) to show the direction of material flow. This helps engineers understand how materials move through the plant.
4. Stream Information
Important data is often included next to process streams in a Process Flow Diagram (PFD), such as:
Temperature
Pressure
Flow rate
Composition
This information helps engineers perform mass and energy balance calculations.
5. Equipment Numbers
Each equipment unit in the Process Flow Diagram (PFD) is assigned a unique identification number for easy reference in engineering documents.
Common Symbols Used in Process Flow Diagram (PFD)
Engineers use standardized symbols when creating a Process Flow Diagram (PFD). These symbols help maintain consistency across engineering designs.
Common Process Flow Diagram (PFD) symbols include:
Circle: Pump
Rectangle: Heat exchanger
Vertical column: Distillation column
Tank symbol: Storage vessel
Triangle: Valve or flow control
Arrow: Process flow direction
Using standard symbols ensures that engineers from different teams can easily understand the Process Flow Diagram (PFD).
Difference Between PFD and P&ID
Many beginners confuse a Process Flow Diagram (PFD) with a Piping and Instrumentation Diagram (P&ID). Although both are important, they serve different purposes.
| Feature | Process Flow Diagram (PFD) | P&ID |
|---|---|---|
| Level of Detail | Basic process overview | Highly detailed |
| Focus | Process flow | Piping and instrumentation |
| Equipment | Major equipment only | All equipment |
| Valves | Usually not shown | All valves included |
| Instrumentation | Not included | Fully included |
In simple terms, the Process Flow Diagram (PFD) shows how the process works, while the P&ID shows how the plant is built and controlled.
Importance of Process Flow Diagram (PFD) in Pharmaceutical Industry
In pharmaceutical manufacturing, a Process Flow Diagram (PFD) plays a critical role in designing, understanding, and managing production processes. Pharmaceutical plants involve complex chemical reactions, purification steps, and strict quality requirements. A Process Flow Diagram (PFD) provides a clear and simplified representation of how raw materials move through different processing units to become finished pharmaceutical products.
1. Process Design
One of the primary uses of a Process Flow Diagram (PFD) is during the early stages of plant and process design. Engineers use the diagram to visualize how different pieces of equipment will be connected and how materials will move through the system.
By studying the Process Flow Diagram (PFD), engineers can determine the sequence of operations such as reactions, separations, filtration, and drying. This helps ensure that the production process is efficient, practical, and capable of producing the desired pharmaceutical product.
2. Process Optimization
A Process Flow Diagram (PFD) helps engineers analyze the efficiency of a manufacturing process. By examining the flow of materials and process steps, engineers can identify areas where improvements can be made.
For example, they may reduce energy consumption, improve reaction efficiency, or eliminate unnecessary processing steps. As a result, the Process Flow Diagram (PFD) becomes an important tool for improving productivity and reducing operational costs in pharmaceutical plants.
3. Safety Analysis
Safety is a major concern in pharmaceutical manufacturing because many processes involve chemicals, high temperatures, and pressure systems. A Process Flow Diagram (PFD) allows safety engineers to review the entire process and identify potential hazards.
By analyzing the Process Flow Diagram (PFD), engineers can locate critical process points where safety systems, alarms, or protective equipment may be required. This helps prevent accidents and ensures safe plant operation.
4. Regulatory Documentation
Pharmaceutical companies must comply with strict regulatory guidelines such as GMP (Good Manufacturing Practices). Regulatory authorities often require detailed documentation of manufacturing processes.
A Process Flow Diagram (PFD) becomes an important part of this documentation because it clearly explains how the manufacturing process works. It helps regulatory inspectors understand the production workflow and verify that the process follows approved standards.
5. Training Tool
A Process Flow Diagram (PFD) is also widely used for training new engineers, operators, and technical staff. It provides a simple visual overview of the entire production process, making it easier for new employees to understand plant operations.
Instead of studying complex technical documents, trainees can refer to the Process Flow Diagram (PFD) to quickly understand how materials move through different equipment units. This makes it an effective educational tool in pharmaceutical manufacturing facilities.
In summary, the Process Flow Diagram (PFD) is an essential engineering document that supports process design, optimization, safety management, regulatory compliance, and workforce training in the pharmaceutical industry. By providing a clear overview of the API manufacturing process, it helps engineers and operators maintain efficient, safe, and compliant manufacturing operations.
Example of Process Flow Diagram (PFD) in API Manufacturing
Let us consider a simplified example of Paracetamol API production to understand how a Process Flow Diagram (PFD) works.
Typical process steps may include:
Raw material charging
Chemical reaction in reactor
Crystallization
Filtration
Drying
Packaging
In the Process Flow Diagram (PFD), each step is represented by process equipment connected by material flow streams. Engineers can easily track the movement of raw materials through the process until the final product is obtained.
Steps to Create a Process Flow Diagram (PFD)
Creating a professional Process Flow Diagram (PFD) is an important task in chemical and pharmaceutical engineering. A well-designed Process Flow Diagram (PFD) helps engineers clearly understand the production process, equipment arrangement, and material movement within a plant. It also serves as a foundation for further engineering documents such as P&IDs, equipment specifications, and process calculations.
Below are the key steps involved in developing a complete Process Flow Diagram (PFD).
Step 1: Define Process Scope
The first step in creating a Process Flow Diagram (PFD) is to clearly define the scope of the process. Engineers must determine the boundaries of the system and identify which parts of the production process will be included in the diagram. This includes identifying where the process starts and where it ends.
For example, in a pharmaceutical manufacturing plant, the process scope may begin with the raw material storage section and end with the final product packaging stage. Defining the process scope ensures that the Process Flow Diagram (PFD) focuses only on relevant operations and avoids unnecessary complexity.
This step also helps engineers understand the overall workflow and decide how different process units will be represented in the diagram.
Step 2: List Major Equipment
After defining the process scope, the next step is to identify all the major equipment involved in the process. The Process Flow Diagram (PFD) typically includes only the primary equipment that plays a significant role in the production process.
Examples of major equipment commonly shown in a Process Flow Diagram (PFD) include reactors, heat exchangers, distillation columns, pumps, storage tanks, filters, evaporators, and dryers. Each piece of equipment is represented using standard engineering symbols.
Listing the equipment helps engineers organize the process steps logically and ensures that the Process Flow Diagram (PFD) accurately reflects the actual plant operation.
Step 3: Identify Process Streams
Once the equipment has been identified, engineers determine how materials flow between different process units. These material movements are called process streams, and they are a key element of the Process Flow Diagram (PFD).
Process streams may include raw materials, intermediate products, final products, solvents, by-products, and waste streams. Each stream is usually assigned a unique stream number for easy reference.
Understanding the process streams allows engineers to track how materials move through the system and helps in performing mass balance and process calculations.
Step 4: Draw Process Connections
In this step, engineers begin drawing the actual Process Flow Diagram (PFD) by connecting the equipment using arrows that represent the direction of material flow. These arrows clearly indicate how raw materials move from one unit operation to another.
For example, a reactor may be connected to a crystallizer, which is then connected to a filtration unit and finally to a dryer. These connections help illustrate the sequence of operations in the process.
Properly drawing these connections ensures that the Process Flow Diagram (PFD) provides a clear and logical representation of the production process.
Step 5: Add Stream Data
After drawing the process connections, engineers add important process information to the streams shown in the Process Flow Diagram (PFD). This information may include parameters such as temperature, pressure, flow rate, and composition of the material.
Including stream data helps engineers analyze the process conditions and perform engineering calculations. In pharmaceutical and chemical industries, this information is essential for process optimization and equipment design.
By adding this data, the Process Flow Diagram (PFD) becomes more informative and useful for process engineers and plant designers.
Step 6: Review and Validate
The final step in creating a Process Flow Diagram (PFD) is to review and validate the diagram with the engineering team. Process engineers, production specialists, and safety experts examine the diagram to ensure that it accurately represents the real process.
During this stage, engineers check whether all equipment and process streams are correctly included and whether the sequence of operations is logical. Any missing information or errors are corrected before the Process Flow Diagram (PFD) is finalized.
This review process ensures that the Process Flow Diagram (PFD) becomes a reliable document for plant design, process analysis, and operational training.
Advantages of Using Process Flow Diagram (PFD)
There are several benefits of using a Process Flow Diagram (PFD) in industrial engineering.
Clear Process Visualization
The Process Flow Diagram (PFD) provides a simple and easy-to-understand overview of the entire process.
Better Communication
Different departments such as production, QA, QC, and maintenance can easily understand the process using the Process Flow Diagram (PFD).
Efficient Plant Design
Engineers can optimize the plant layout by studying the Process Flow Diagram (PFD).
Troubleshooting
When problems occur in the plant, the Process Flow Diagram (PFD) helps identify the affected process step.
Documentation
The Process Flow Diagram (PFD) becomes a part of the official engineering documentation.
Software Used to Create Process Flow Diagram (PFD)
Several engineering tools are used to design a Process Flow Diagram (PFD).
Popular tools include:
AutoCAD
Aspen Plus
Microsoft Visio
SmartDraw
Lucidchart
These tools help engineers design professional Process Flow Diagram (PFD) drawings quickly and accurately.
Future of Process Flow Diagram (PFD) in Digital Engineering
With the rise of digital engineering and Industry 4.0, the Process Flow Diagram (PFD) is becoming more advanced.
Modern software now integrates Process Flow Diagram (PFD) with:
Process simulation
Digital twins
Plant automation
Data analytics
These technologies allow engineers to analyze process performance before building the plant.
Conclusion
The Process Flow Diagram (PFD) is one of the most important tools used in chemical and pharmaceutical engineering. It provides a clear overview of the process, helping engineers design, analyze, and optimize production systems.
From plant design to safety analysis and process optimization, the Process Flow Diagram (PFD) plays a critical role in industrial operations. Understanding how to read and create a Process Flow Diagram (PFD) is therefore an essential skill for chemical engineers, process engineers, and pharmaceutical professionals.
For more engineering guides and pharmaceutical calculation resources, visit pharmacalculations.in.
Frequently Asked Questions (FAQ)
1. What is a Process Flow Diagram (PFD)?
A Process Flow Diagram (PFD) is a simplified diagram that shows major equipment and the flow of materials in an industrial process.
2. What is the purpose of a Process Flow Diagram (PFD)?
The main purpose of a Process Flow Diagram (PFD) is to help engineers understand and visualize the overall process flow in a plant.
3. What is the difference between PFD and P&ID?
A Process Flow Diagram (PFD) shows major equipment and process flow, while a P&ID shows detailed piping, instrumentation, and control systems.
4. Why is PFD important in pharmaceutical manufacturing?
A Process Flow Diagram (PFD) helps in plant design, process optimization, safety analysis, and regulatory documentation in pharmaceutical industries.
5. Which software is used to create PFD?
Common software used for creating a Process Flow Diagram (PFD) includes AutoCAD, Aspen Plus, Visio, and SmartDraw.